Rails performance reporting

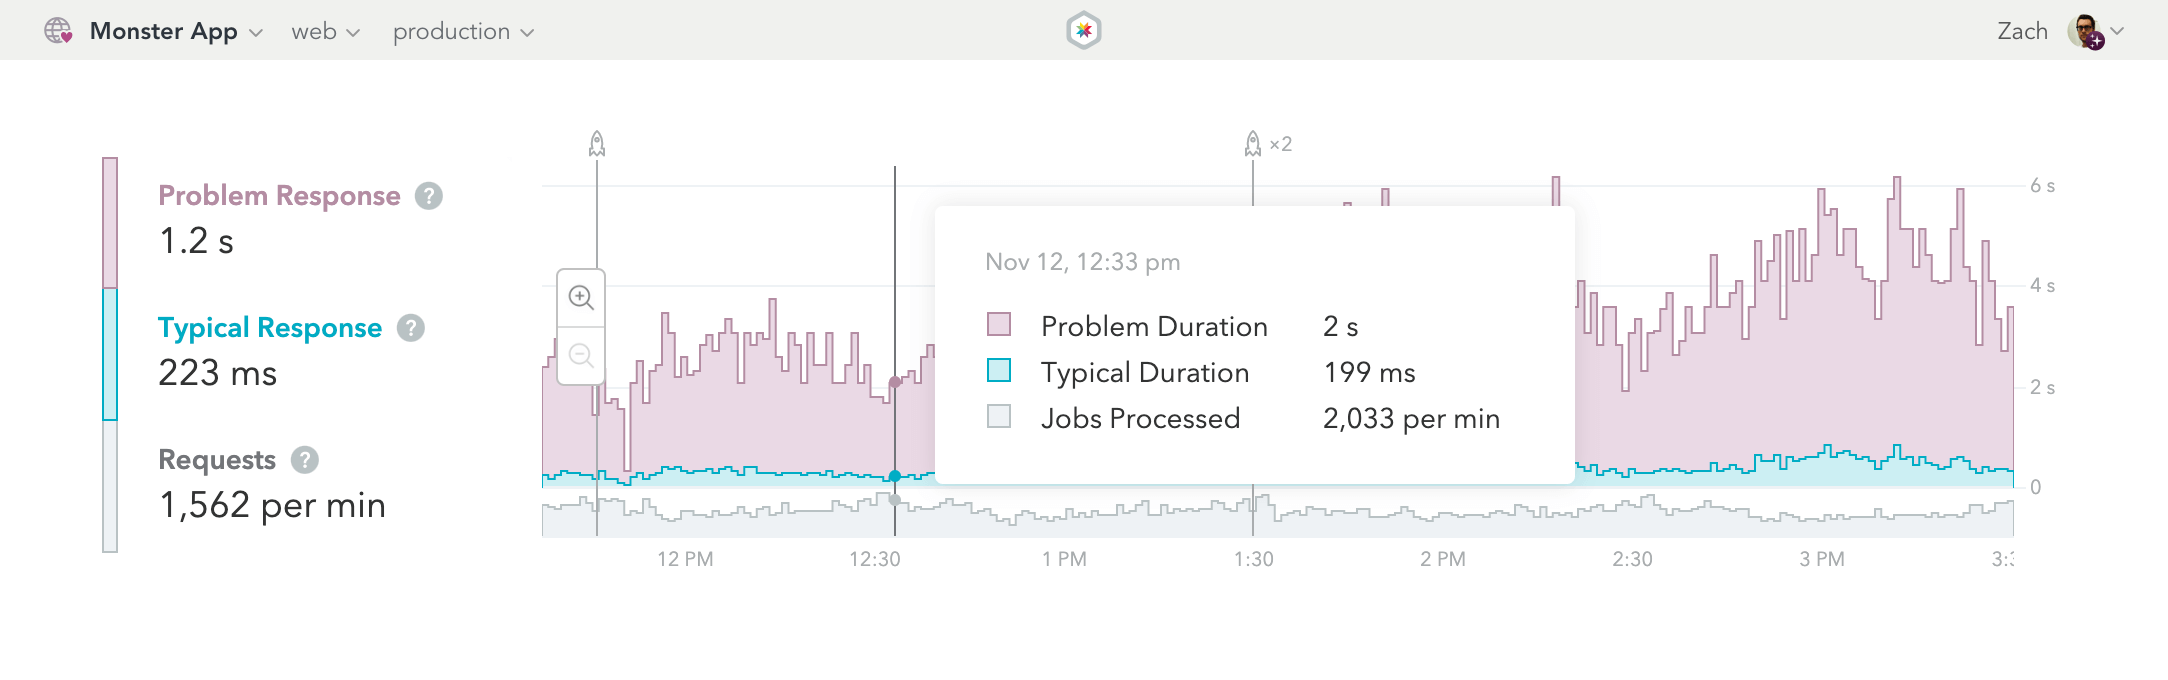
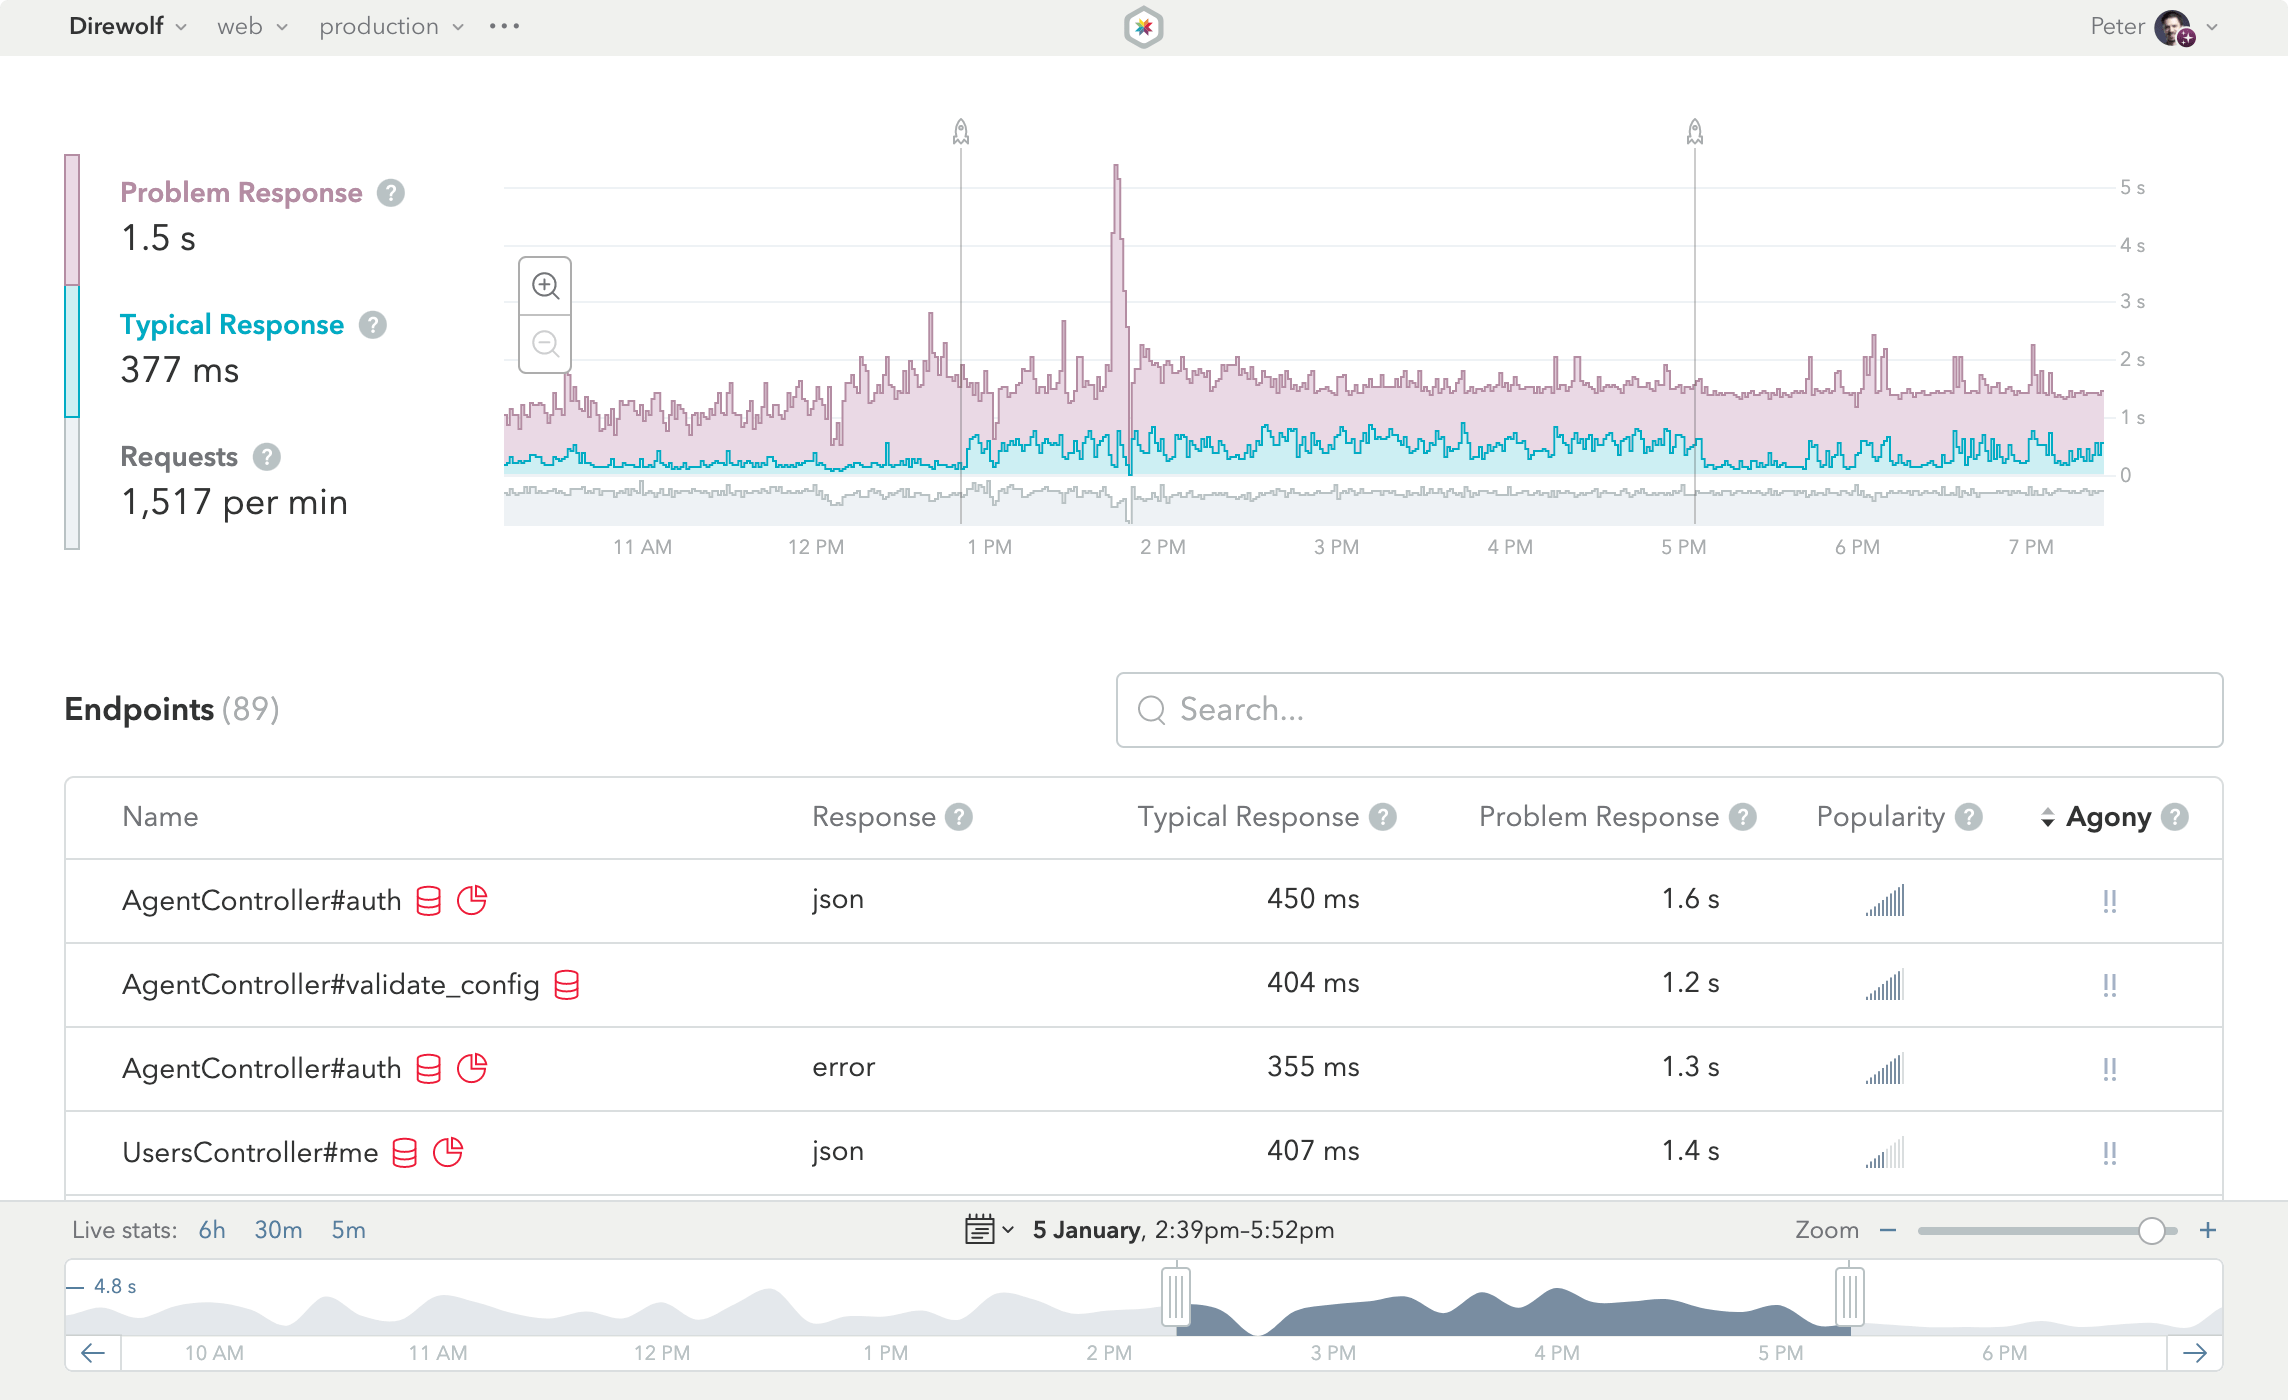
Skylight visualizes all your app’s performance data in a way that makes it easy to understand and act on.

  • Intuitive Interface

    Our visualizations don't require you to be a performance expert to markedly improve your app.
  • True response times

    See typical speeds as well as problem responses for an in-depth look at your app’s performance.
  • Featherweight Agent

    Skylight is written in Rust, which uses fewer resources than the Ruby agents of our competitors.
  • Deploy Tracking

    We plot deploys on a graph so you can see how changes in your code are affecting performance.
  • Background Jobs

    Discover and correct hidden performance issues in your Sidekiq, DelayedJob, and ActiveJob queues.
  • More than rails

    We support many Ruby frameworks including Rails, Sinatra, and Grape.

Sources of agony

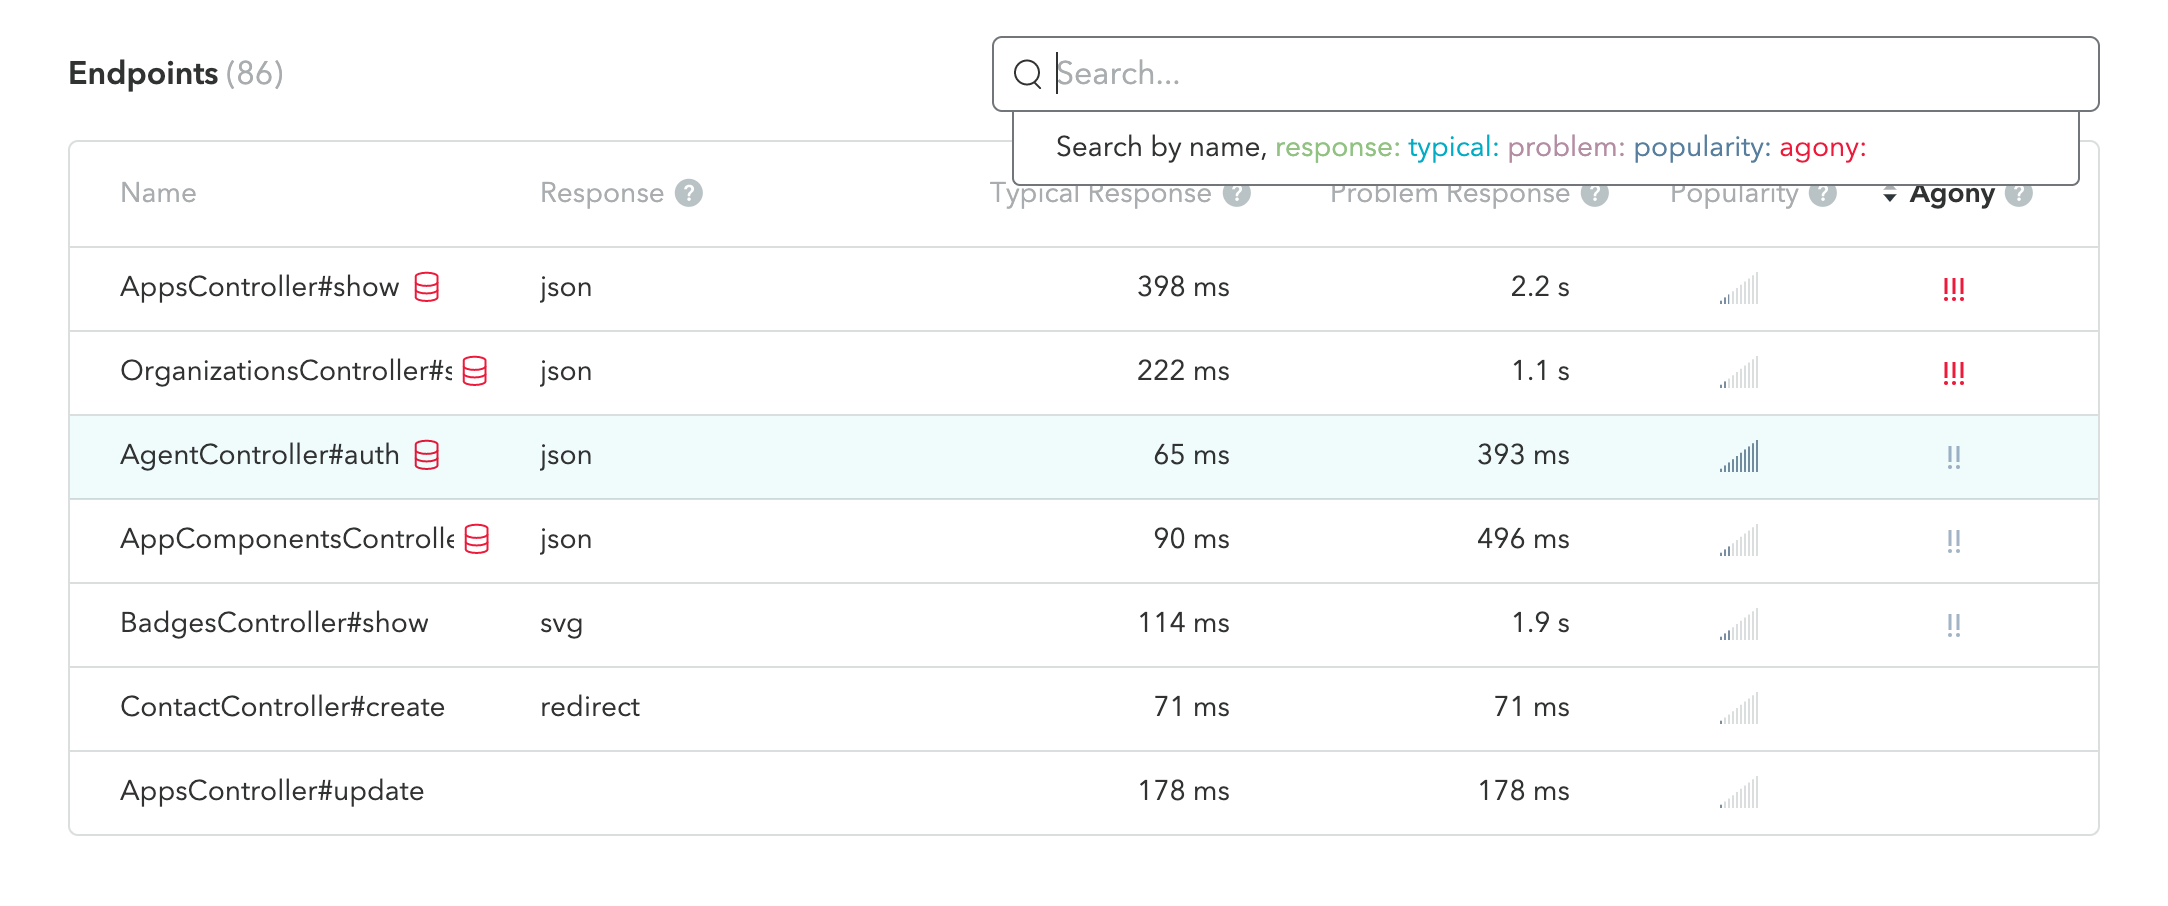
Skylight sorts your endpoints by “agony” — a combination of popularity and response time — to show you which endpoints to improve for the biggest performance gains.

  • Mistake detection

    Skylight notifies you of allocation hogs and repeated queries that may slow down your app.
  • Endpoint exploration

    In addition to agony, you can sort, filter, and search by other attributes to find exactly what you’re looking for.
  • Response types

    Don't mix apples and oranges. Skylight separates html, json, and errors so you get a clear picture of each.

Endpoint intelligence

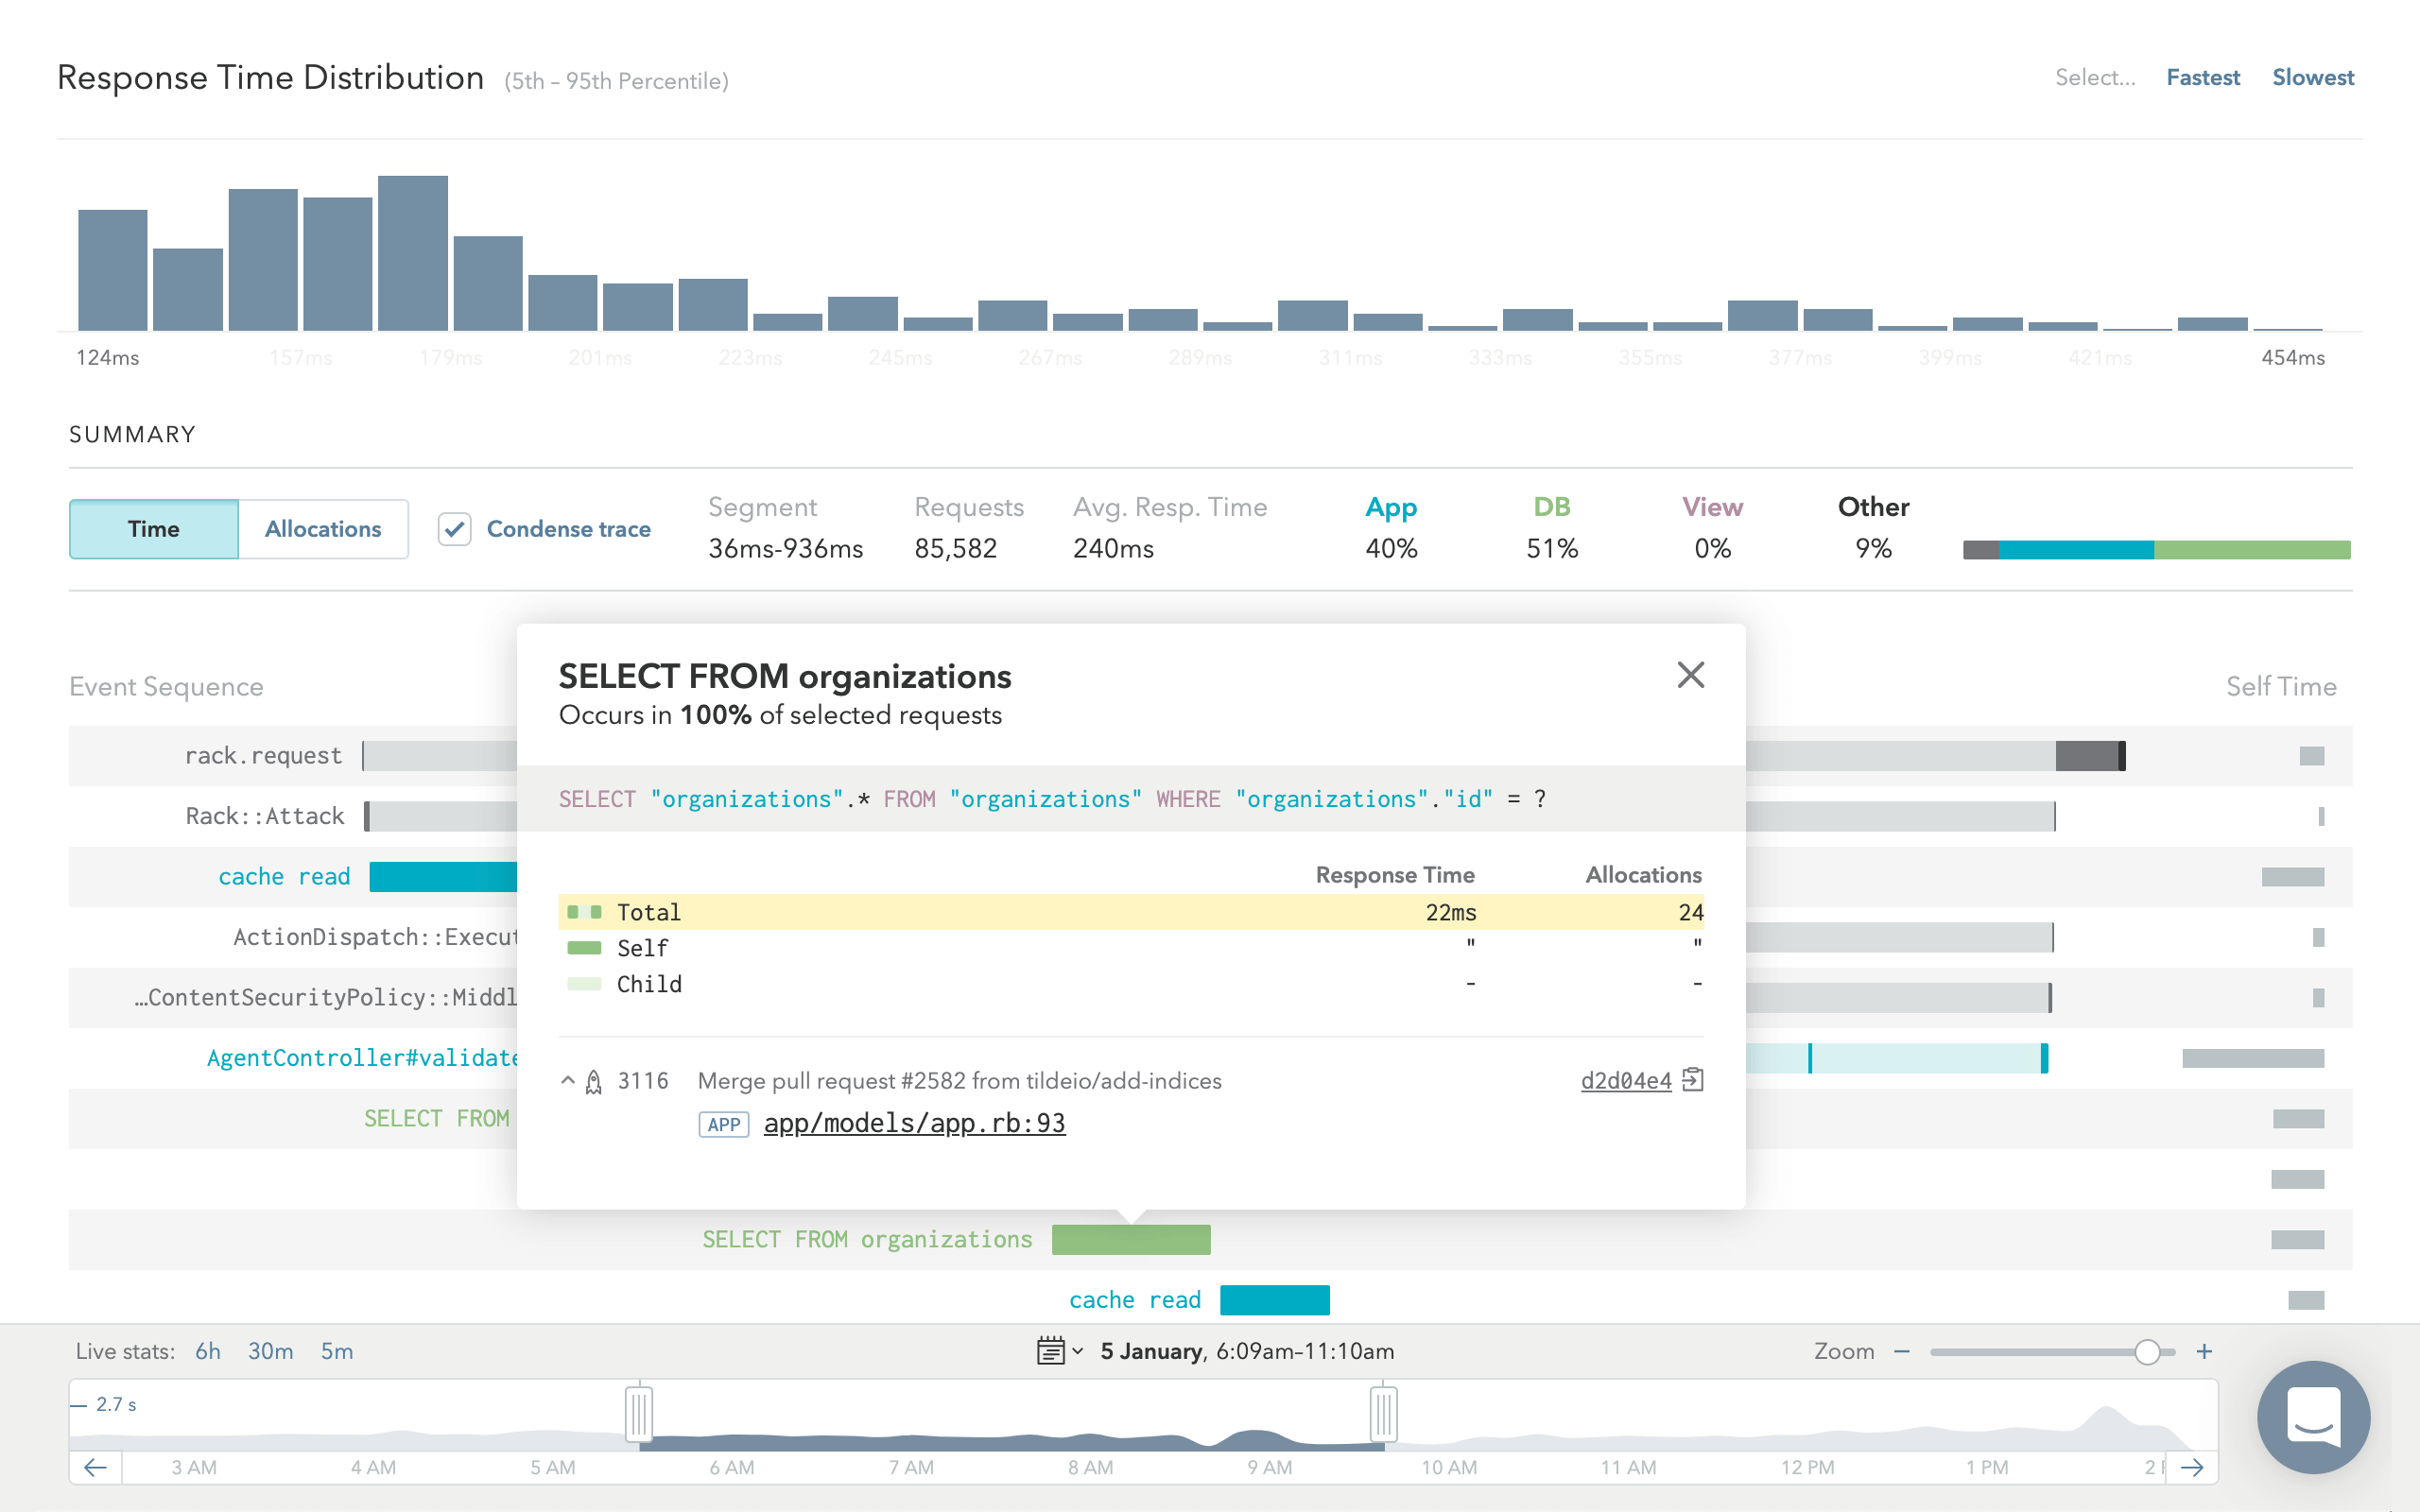
Interact with Skylight’s endpoint data to understand the events that lead to slowdowns and how to prevent them in the future.

  • Response time distribution

    View a histogram of response times and discover low-frequency slowdowns that skew your average.
  • Event sequence

    See aggregate event sequences by time or allocations to find out where bottlenecks are occurring.
  • Timeline filter

    Pinpoint your slowest responses. Hone in on the differences between your fastest and slowest responses.
  • GraphQL Support

    See GraphQL queries aggregated by name in the dashboard and endpoint event sequences.
  • Aggregated SQL Analysis

    Click an event in the timeline to see aggregated, sanitized SQL queries to troubleshoot issues.
  • Source Locations

    Discover which code is responsible for a timeline event, right down to the line number.

Communicate improvements

Our trends feature distills your performance data into a weekly report that helps you catch slowdowns before your customers do.

  • Most improved endpoints

    See the results of your performance improvement efforts and share them with stakeholders.
  • Slowdown warnings

    See which endpoints have slowed the most since last week to anticipate potential performance issues.
  • Frog boils

    Discover which endpoints have slowly declined in performance over a six week period.

Great for Open-Source Apps.

Open-source apps can use Skylight for free to help encourage contributors to find and fix performance issues.

Explore some open-source apps using Skylight

Learn about Skylight for Open Source

Try it yourself

Make friends with performance data, no credit card required.

Start Your Free Month